The purpose of this research paper is to determine if the overall size of Toronto's budget is within a reasonable range of other cities' that are similarly ranked to Toronto.
The 16 cities chosen, were based on the Globalization and World Cities Research Network ranking of world cities.(http://www.lboro.ac.uk/gawc/world2016t.html) To simplify the research, only municipalities with budgets published in English were selected. The most recent, fully published budget on the municipalities' website were used. Also Alpha++ cities were excluded, as the size of those cities' budgets were magnitudes larger than Toronto's.
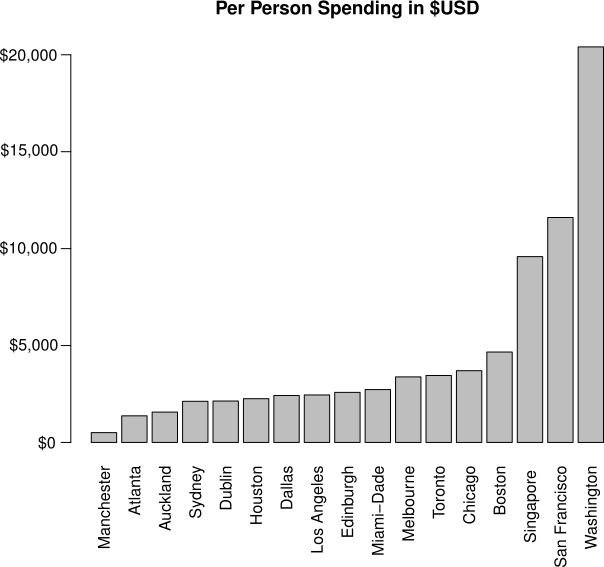
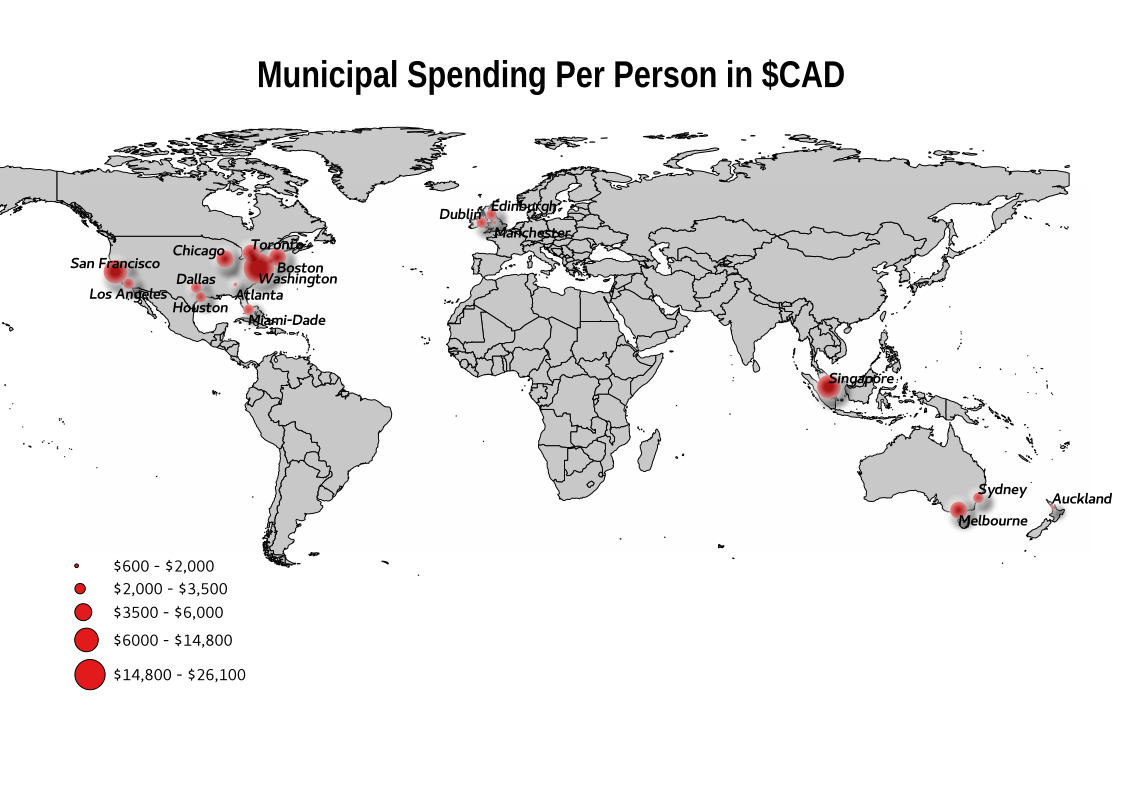
One limiting factor in the research conduced was that only the official political boundary for a city was used. For example Toronto's metropolitan region may include Peel, and Durham for some, other's may consider the boundary area of metropolitan Toronto to include Hamilton and Newmarket. The discrepancy between the official boundaries of a city and a metropolitan area pronounced particularly for places such as Sydney and Atlanta. However by prorating the total budget expenditure by total population gives how much each city is spending per individual. This allows for some direct comparison.
Bibliography
1:50m Cultural Vectors: Admin 0 - Countries. (n.d.). Natural Earth. Retrieved from http://www.naturalearthdata.com/http//www.naturalearthdata.com/download/50m/cultural/ne_50m_admin_0_countries.zip
Adopted Budget, Fiscal Year 2018. (n.d.). City of Atlanta. Retrieved from https://www.atlantaga.gov/home/showdocument?id=27831
Annual Financial Statements: For The Year Ended 31st December 2015. (2016). Dublin City Council. Retrieved from http://www.dublincity.ie/sites/default/files/content/YourCouncil/AbouttheCouncil/CouncilSpendingRevenue/Documents/AFS2015.pdf
Bowser, M. (2017, July 19). FY 2018 Proposed Budget and Financial Plan: DC Values in Action - A roadmap to inclusive prosperity. Government of the District of Columbia. Retrieved from https://cfo.dc.gov/sites/default/files/dc/sites/ocfo/publication/attachments/DC%20GOVT%20FY%202018%20BUDGET%20%E2%80%93%20CONGRESS%20%E2%80%93%20VOL%201.pdf
Brown, C., & Turner, S. (2017). City of Houston Fiscal Year 2018 Proposed Budget, For the Period July 1, 2017 to June 30, 2018. City of Houston. Retrieved from http://www.houstontx.gov/budget/18budprop/FY2018_Proposed_Budget.pdf
Budget Summary. (2017). City of Toronto. Retrieved from https://www1.toronto.ca/City%20Of%20Toronto/Strategic%20Communications/City%20Budget/2017/PDFs/2017%20Public%20Book.pdf
City of Edinburgh Council Key Facts and Figures 2017-2018. (n.d.). The City of Edinburgh Council. Retrieved from http://www.edinburgh.gov.uk/download/downloads/id/9493/key_facts_and_figures_booklet_2017-2018.pdf
City of Melbourne’s Annual Report for 2016-17. (n.d.). Retrieved from https://www.melbourne.vic.gov.au/SiteCollectionDocuments/annual-report-2016-17-financial-report.pdf
City of Sydney Annual Report: General Purpose Financial Statements 2015-16. (n.d.). City of Sydney. Retrieved from http://www.cityofsydney.nsw.gov.au/__data/assets/pdf_file/0010/277813/Annual-Financial-Report-2015-16.pdf
City of Sydney Annual Report: Statutory Returns 2015-16. (n.d.). City of Sydney. Retrieved from http://www.cityofsydney.nsw.gov.au/__data/assets/pdf_file/0006/277809/COS-Annual-Report-201516_ACCESSIBLE.pdf
Daily Population Estimates and Forecasts. (2017). City of Melbourne. Retrieved from http://www.melbourne.vic.gov.au/SiteCollectionDocuments/daily-population-estimates-and-forecasts-report-2017.pdf
Emanuel, R. (n.d.). 2018 Budget Overview. City of Chicago. Retrieved from https://www.cityofchicago.org/content/dam/city/depts/obm/supp_info/2018Budget/2018_Budget_Overview.pdf
Financial Transparency, Financial Documents, Annual Budget, Budget Overview. (n.d.). City of Dallas. Retrieved from http://dallascityhall.com/departments/budget/financialtransparency/AnnualBudget/2-Budget-Overview.pdf
Fiscal Year 2018 Budget Beginning July 1, 2017 and ending June 30, 2018 - Executive Summary. (2017). City of Boston. Retrieved from https://budget.boston.gov/
Garcetti, E., Galperin, R., & Llewellyn, R. (2017, May 24). Budget, Fiscal Year 2017-2018. City of Los Angeles. Retrieved from https://drive.google.com/file/d/0B4o0_mxqwWdORDA2SkFjSG9PX0E/view
GeoHack. (n.d.). Wikimedia Cloud Services. Retrieved from https://tools.wmflabs.org/geohack/
Gimenez, A. (n.d.). Proposed Budget & Multi-Year Capital Plan, Fiscal Year 2017-18, Budget in Brief. Miami-Dade County.
Lee, E. (n.d.). Proposed Budget. City & County of San Francisco, California. Retrieved from http://sfmayor.org/sites/default/files/CSF_Budget_Book_2017_Final_CMYK_LowRes.pdf
Manchester City Council Annual Report Incorporating Statement of Accounts 2016/17. (n.d.). Retrieved from http://www.manchester.gov.uk/downloads/download/6771/audited_accounts_201617
Population and Population Structure. (n.d.). Singapore Department of Statistics. Retrieved from http://www.singstat.gov.sg/statistics/browse-by-theme/population-and-population-structure
Population of each Province, County and City, 2011. (n.d.). Central Statistics Office. Retrieved from http://www.cso.ie/en/statistics/population/populationofeachprovincecountyandcity2011/
Population of Edinburgh. (n.d.). The City of Edinburgh Council. Retrieved from http://www.edinburgh.gov.uk/info/20247/edinburgh_by_numbers/34/population_of_edinburgh
QuickFacts - selected: Chicago city, Illinois. (n.d.). U.S. Department of Commerce, United States Census Bureau. Retrieved from https://www.census.gov/quickfacts/fact/table/chicagocityillinois/LND110210
QuickFacts Selected: Atlanta city, Georgia. (n.d.). U.S. Department of Commerce, United States Census Bureau. Retrieved from https://www.census.gov/quickfacts/fact/table/atlantacitygeorgia/PST045216
QuickFacts: selected: Boston city, Massachusetts. (n.d.). U.S. Department of Commerce, United States Census Bureau. Retrieved from https://www.census.gov/quickfacts/fact/table/bostoncitymassachusetts/POP060210#viewtop
QuickFacts selected: Dallas city, Texas. (n.d.). U.S. Department of Commerce - United States Census Bureau. Retrieved from https://www.census.gov/quickfacts/fact/table/dallascitytexas/PST045216
QuickFacts selected: District of Columbia. (n.d.). U.S. Department of Commerce, United States Census Bureau. Retrieved from https://www.census.gov/quickfacts/fact/table/DC/PST045216
QuickFacts selected: Houston city, Texas. (n.d.). U.S. Department of Commerce, United States Census Bureau. Retrieved from https://www.census.gov/quickfacts/fact/table/houstoncitytexas#viewtop
QuickFacts selected: Los Angeles city, California. (n.d.). U.S. Department of Commerce, United States Census Bureau. Retrieved from https://www.census.gov/quickfacts/losangelescitycalifornia
QuickFacts selected: Miami-Dade County, Florida. (n.d.). U.S. Department of Commerce, United States Census Bureau. Retrieved from https://www.census.gov/quickfacts/fact/table/miamidadecountyflorida/PST045216
QuickFacts selected: San Francisco County, California. (n.d.). U.S. Department of Commerce, United States Census Bureau. Retrieved from https://www.census.gov/quickfacts/fact/table/sanfranciscocountycalifornia/PST045216
Revenue and Expenditure Estimates: Overall Budget Balance. (2017). Government of Singapore. Retrieved from http://www.singaporebudget.gov.sg/budget_2016/RevenueandExpenditure
Summary Annual Report: Summary Statement of Comprehensive Revenue and Expenditure for the year ended 30 June 2017. (n.d.). Auckland Council. Retrieved from https://www.aucklandcouncil.govt.nz/plans-projects-policies-reports-bylaws/our-annual-reports/Documents/summary-annual-report-2016-2017.pdf